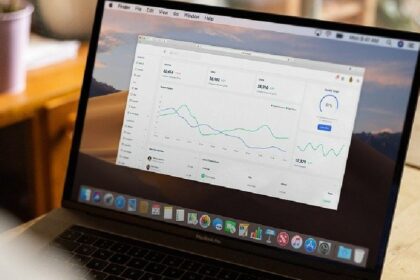
Do you need to create charts, infographics, or a data story? Need a tool to succeed in that task? In this list below you find my personal list of eleven online and free tools to achieve your goal.


Do you need to create charts, infographics, or a data story? Need a tool to succeed in that task? In this list below you find my personal list of eleven online and free tools to achieve your goal.

Esta es mi lista de herramientas en línea y gratuitas favorita para visualizar datos. Si les es de utilidad este recurso, ¡Compartan la lista! Si tienen otras herramientas para recomendar, envíeme un tuit 🙂 a @HasselFallas

Iniciativas de investigación focalizadas en la defensa de los Derechos Humanos: Acceso al agua, matrimonio infantil, discriminación de personas LGBTIQ+, entre otros, figuran en esta lista.

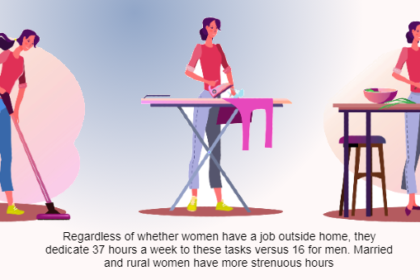
Regardless of whether women have a job outside home, they dedicate 37 hours a week to these tasks versus 16 for men. Married and rural women have more strenuous hours. Unpaid work at home includes cooking, cleaning, washing, caring for children, the elderly, and the sick. Activities without which the country’s economy would not function.

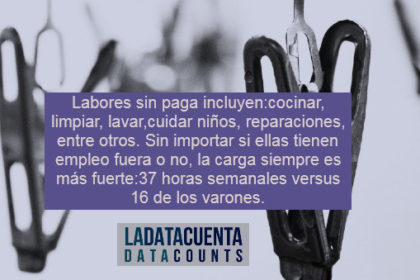
Carga es más desproporcionada para las mujeres: sin importar tienen empleo fuera o destinan 37 horas semanales a estas tareas versus 16 de los varones. Las casadas y de zona rural tienen jornadas más extenuantes.

The fundamental impact of data visualization was to help us understand and give us useful answers in the midst of the great uncertainty of the pandemic. Hand in hand with visual and data journalists, we have been decoding what Covid-19 is about and how we can learn to live with it. It served to educate us, assimilate epidemiological terms and speak of them properly. It has served to take care of us.