


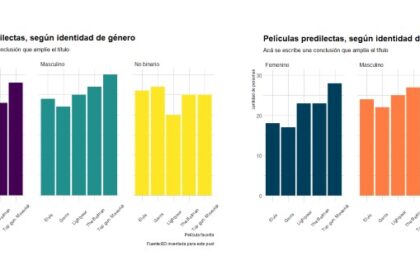
Una de mis herramientas predilectas es R y sus librerías para visualizar datos. Justamente en este artículo te guiaré en el uso de una de las librerías más famosas: la versátil ggplo2. Antes de empezar te dejo algunos conceptos base relevantes.


Una de mis herramientas predilectas es R y sus librerías para visualizar datos. Justamente en este artículo te guiaré en el uso de una de las librerías más famosas: la versátil ggplo2. Antes de empezar te dejo algunos conceptos base relevantes.
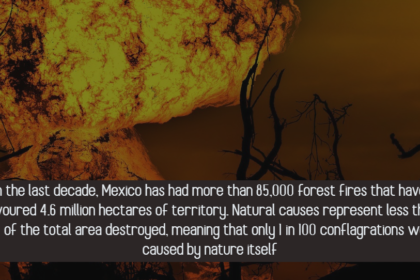
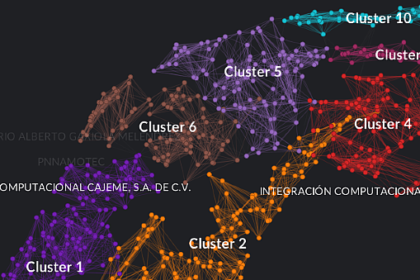
The history of mankind is linked to that of fire, but when people deliberately or negligently cause fires, they have devastating consequences for the environment, health and safety of others. In the last decade, Mexico has had more than 85,000 forest fires that have devoured 4.6 million hectares of territory. Natural causes represent less than 10% of the total area destroyed, meaning that only 1 in 100 conflagrations were caused by nature itself.
Para mí, el análisis de datos y la visualización son hermanas siamesas, siempre están unidas. Simultáneamente, la visualización es una herramienta de análisis de datos y una herramienta de comunicación visual. Como herramienta de análisis, la visualización sirve para encontrar ángulos noticiosos que suelen quedar ocultos entre tablas dinámicas o cruzadas. Como herramienta de comunicación, la visualización facilita al receptor la comprensión de un tema complejo.
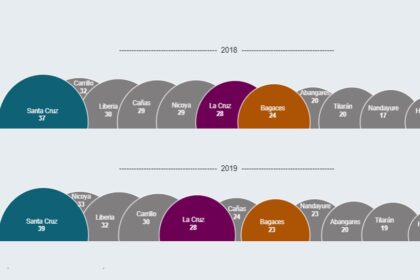
La violencia contra las mujeres es un asunto de derechos humanos que los Estados del mundo están obligados a prevenir, sancionar y erradicar. Los siguientes gráficos interactivos se enfocan en mostrar la situación de la violencia que viven las mujeres de Guanacaste, una de las 7 provincias de Costa Rica.
En este artículo cuento mi propia experiencia de amor y odio con la matemática y cómo esa fobia, que desarrollé en la adolescencia, me hizo renunciar a una carrera de ingeniería para dedicarme al periodismo y la comunicación. Afortunadamente, en la universidad, la Estadística me devolvió la pasión por los números y desde hace más de una década mezclo el periodismo con el análisis de datos. Ayudando a otros periodistas, también, a vencer el miedo a trabajar con hojas de cálculo.
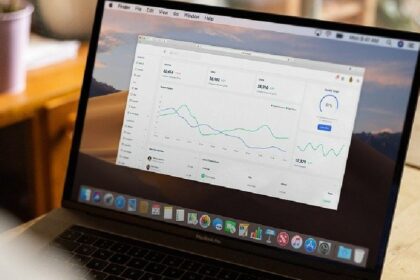
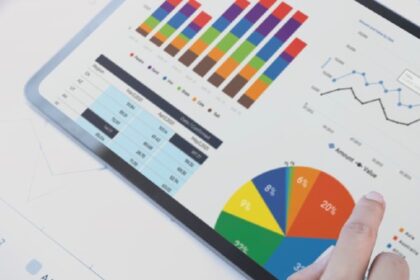
Do you need to create charts, infographics, or a data story? Need a tool to succeed in that task? In this list below you find my personal list of eleven online and free tools to achieve your goal.


