Showing: 19 RESULTS

2020: The great year of Data and Visual Journalism to explain the pandemic

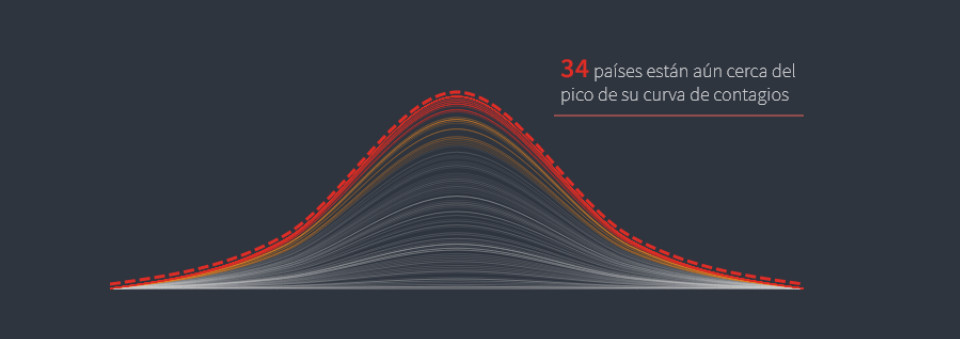
The fundamental impact of data visualization was to help us understand and give us useful answers in the midst of the great uncertainty of the pandemic. Hand in hand with visual and data journalists, we have been decoding what Covid-19 is about and how we can learn to live with it. It served to educate us, assimilate epidemiological terms and speak of them properly. It has served to take care of us.

2020:El gran año del periodismo visual y de datos

En periodismo visual y de análisis de datos el tema que marcó la tendencia en el año es la pandemia por la Covid-19. Estos trabajos demuestran que el periodismo debe ser útil y que cuando se hace para explicar a la gente los porqués de aquello que les afecta, la retribución del usuario es la confianza y el reconocimiento del valor de ese contenido.

Journalism: how to build a future by getting out of your comfort zone

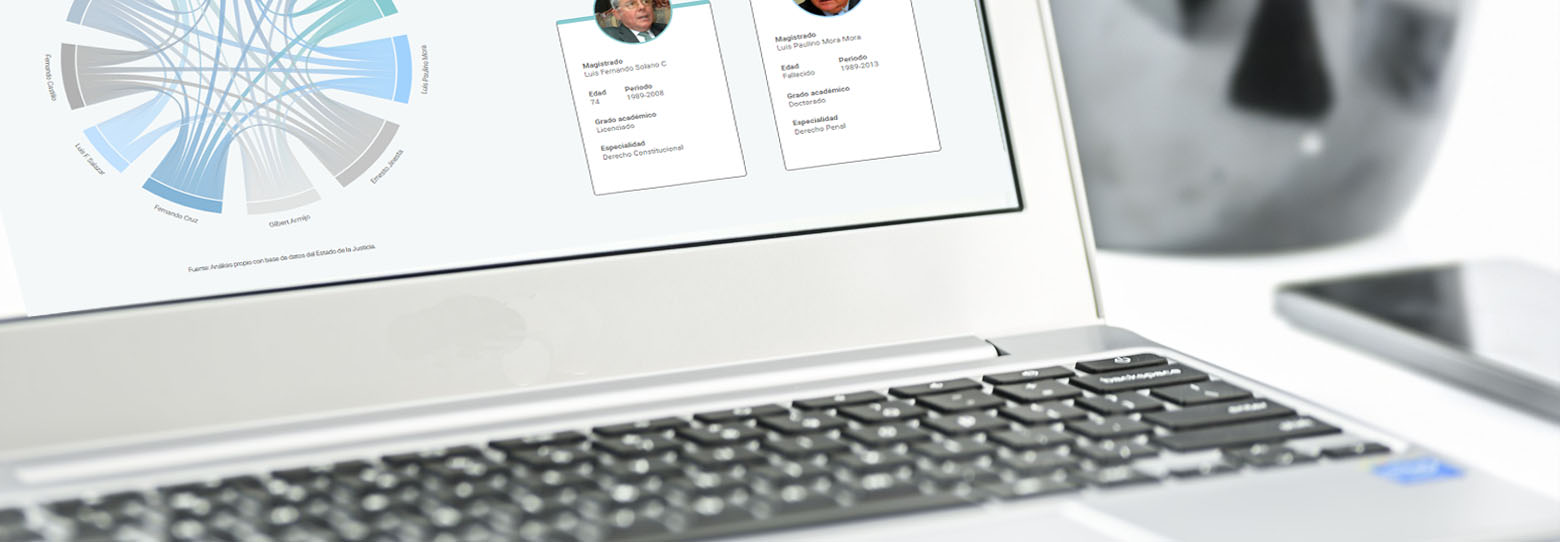
The fear of numbers is one of the worst comfort zones where a journalist can fall. Today, numbers are a mine of gold for journalists who know what to do with big data, open data movements, scrap data, or create their own data sets. But just like a miner, you need tools, equipment to extract that gold and present it in attractive ways to your audience.

error: No se puede descargar