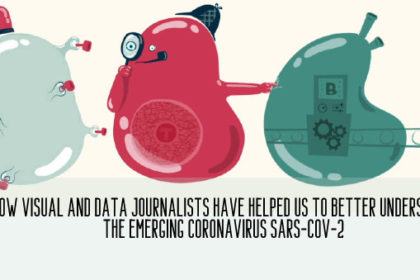
The fundamental impact of data visualization was to help us understand and give us useful answers in the midst of the great uncertainty of the pandemic. Hand in hand with visual and data journalists, we have been decoding what Covid-19 is about and how we can learn to live with it. It served to educate us, assimilate epidemiological terms and speak of them properly. It has served to take care of us.
English post
Databases and algorithms, super powers for Investigative Journalism
Do you know what databases and algorithms are? Probably your answer is affirmative. If you have access to an Internet …
How to tell a good story with data?
Numbers are not boring … Bored are the people who do not know how to use them to tell a …
68 articles, tricks and tips to deepen in data journalism, analysis and visualization
Did this ever happen to you: remember an article that you would like to consult, but forgot the link, title …
Five reasons to tell journalistic stories with databases
How are databases useful for journalism?, those numbers that sometimes seem so esoteric or infallible. To answer, I want to …
Um conto de jornalismo, coelhos e base de dados
Esta é a história de um coelho periodista empenhado em se aproximar, o máximo possível, da verdade dos fatos. Sua …