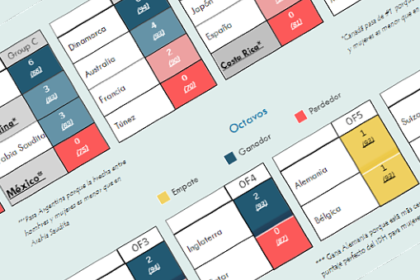
Showing: 8 RESULTS

Climate change and data visualization

Facts and effects of climate change in your life is a weekly platform of data journalism and short narratives to explain younger people in Costa Rican what is Climate Change and how it impacts their daily lives. We use graphs, data, voices of science and activism to tell in simple, but deep way why all should care about global warming.

Mexico under fire

The history of mankind is linked to that of fire, but when people deliberately or negligently cause fires, they have devastating consequences for the environment, health and safety of others. In the last decade, Mexico has had more than 85,000 forest fires that have devoured 4.6 million hectares of territory. Natural causes represent less than 10% of the total area destroyed, meaning that only 1 in 100 conflagrations were caused by nature itself.

2020: The great year of Data and Visual Journalism to explain the pandemic

The fundamental impact of data visualization was to help us understand and give us useful answers in the midst of the great uncertainty of the pandemic. Hand in hand with visual and data journalists, we have been decoding what Covid-19 is about and how we can learn to live with it. It served to educate us, assimilate epidemiological terms and speak of them properly. It has served to take care of us.

Los álbumes más diversos de la banda de rock Queen

Un análisis de 179 las canciones de la legendaria banda británica para determinar cuáles se parecen más o menos entre sí y cómo influyeron en la variedad de sonidos incluida en cada disco de estudio. Hecho a partir de datos extraídos de la API de Spotify, sus características de audio para cada canción y la técnica de clústeres de vecinos más cercanos

error: No se puede descargar