Reflections on the panel: Journalism and Open Data presented at the #Abrelatam15 and #ConDatos15 in Santiago de Chile in September 2015
Second part (Read in spanish)
There are multiple definitions of Data Journalism and although many claim that trying to conceptualize it is useless, at least it is important to have a framework that allows us to measure its scope.
For example, Meredith Broussard, professor at Temple University believes that «data journalism is the practice of finding news in numbers and using numbers to tell news.»
Personally, I think that Data Journalism goes way further. It is about making a research or a report of public interest, based on the creation and analysis of databases; whether they contain millions, thousands, or hundreds of records.
The results are evident in publications that may include data visualizations, news applications, the methodological explanation, and public access to the data matrix of the project.
Regardless of the diversity of views on what data journalism is, there is a fundamental condition to do so. Such input consists of structured data.
In other words, the information contained in a comprehensible database to be processed by a computer. This allows us to do calculations, cross databases, and raise statistical or mathematical models for analysis.
What is data journalism?
Data Journalism is not about making a report with numbers and drawing five or six interesting facts; it is not about only writing an article or synthesizing such facts in a graphic piece.
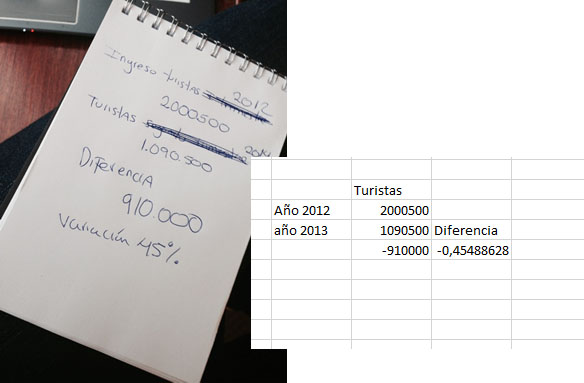
Nor it is a set of unstructured numbers, as those we score on a sheet of paper, or a Word or even an Excel sheet.
In order to have data journalism, we need a considerable amount of data to analyze, look for trends, cross the same with other bases and, very important, contextualize the results, including of course the inescapable reporting. To go out to the streets.
What are data?
«Data are (numerical, alphabetical, algorithms, spatial, etc.) symbolic representations of quantitative or qualitative attributes or variables»
I add: they must be structured and understandable to be processed by a computer. Data alone do not say much, but when compared to something or assessed within a context they can tell the best of all stories.
The image shows examples of UNSTRUCTURED DATA.

Where do databases come from?
In my country, Costa Rica, in general terms, there is sufficient legislation to guarantee access to public information, respect the freedom of press and expression, and promote the transparency of institutions.
There is also significant case law in favor of the right to request access to information, provided it does not affect the rights of other citizens. It excludes, for instance, access to bank accounts, tax returns, medical records, telephone numbers, home addresses, photographs, or workplace (except for civil officers).
However, there is not, yet, a law that defines the guidelines for access to public information.
So far, in the Data Intelligence Unit of La Nación, in Costa Rica, most of our projects have been based on requests for access to public databases. That is, those databases that are not available for download from the Internet with all the necessary variables for journalistic purposes and without infringing the citizens’ rights mentioned above.
In order to obtain administrative information of our interest, we have had to resort to formal personal and email requests.
However, open and semi-open formats existing in the Websites of the National Institute of Statistics and Census, the Supreme Court of Elections, the Foreign Trade Promoter, the Central Bank of Costa Rica, the Comptroller General’s Office, the Costa Rican Social Security Board, the Central American Population Center of the University of Costa Rica and the Judiciary, to mention the most recurring ones, have been an important input to expedite the development of some publications.
In most of these Websites, it is possible to get data in an Excel or CSV format. However, in cases such as the INEC, the CCSS, and the CCP it is necessary to have a basic knowledge of systems such as Redatam, a tool to manage databases and queries.
The foregoing in order to combine databases, cross variables, and build filters that will shape the table with information of interest.

An increased availability of open data would certainly expedite our journalistic function and allow us do more.
However, available open data must be complete, of quality, comprehensive, updated, and of public value and interest in order to be analyzed.
On this last point, it is not about putting anything online and making a graph with the five aspects that an officer found interesting (it happens sometimes).
It is about providing access to relevant databases, such as:
- Commercial patents by type, located by district in each county, legal force.
- Initial and final enrollment in every school in the country by grade, school type, and geographic location.
- Tourist statistics broken down by origin of visitors, type of route of entry.
- Cost of basic food basket by food group.
- Types of offenses by category and location of the event, to name just a few.
About: what are quality and complete data? A database is complete when it contains precise, reliable, and comprehensive data. The information does not eliminate important variables, like the basis for calculating percentages, for example, but it is presented in its purest form.
The quality of this information depends on whether or not it has misspelled words, wrong figures, repetitions, or gaps.
Validating that both principles are met is a critical factor that must be guaranteed before engaging in any type of analysis.
Data release
In the Unit, the sets used to support projects of research, analysis, and visualization of data can be downloaded by those who wish to explore the information on their own.
These databases are available and generally accompany the article explaining the methodology used for analysis. Including an explanation of the method being followed is a fundamental rule of Data Journalism. It is vital that the reader know how the study was conducted, each step followed by the journalist, the exclusions or inclusions of figures, and the criteria applied, among others.
To date, the following bases are available:
- Fewer children in the classroom (enrollment in public schools between 2009 and 2014)
- Importation of cars from 2008 to 2014
- Undergraduate programs (graduates info from 2008 to 2010)
- Investigation on the hidden subsidy on gasoline
- High school students’ dropout (data from 643 schools between 2011 and 2013)
- Special on recycling by county
- Popular initiatives (draft laws until 2013) Json
Our intention is to tell the reader the process applied to data, in case they want to replicate it, criticize it, or improve it. Or this, it is vital to have access to the data used in the study.

