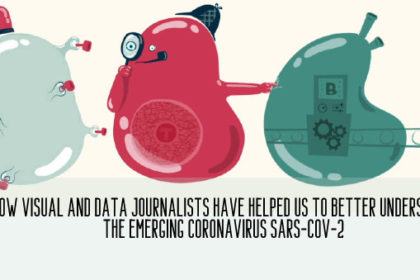
The fundamental impact of data visualization was to help us understand and give us useful answers in the midst of the great uncertainty of the pandemic. Hand in hand with visual and data journalists, we have been decoding what Covid-19 is about and how we can learn to live with it. It served to educate us, assimilate epidemiological terms and speak of them properly. It has served to take care of us.


